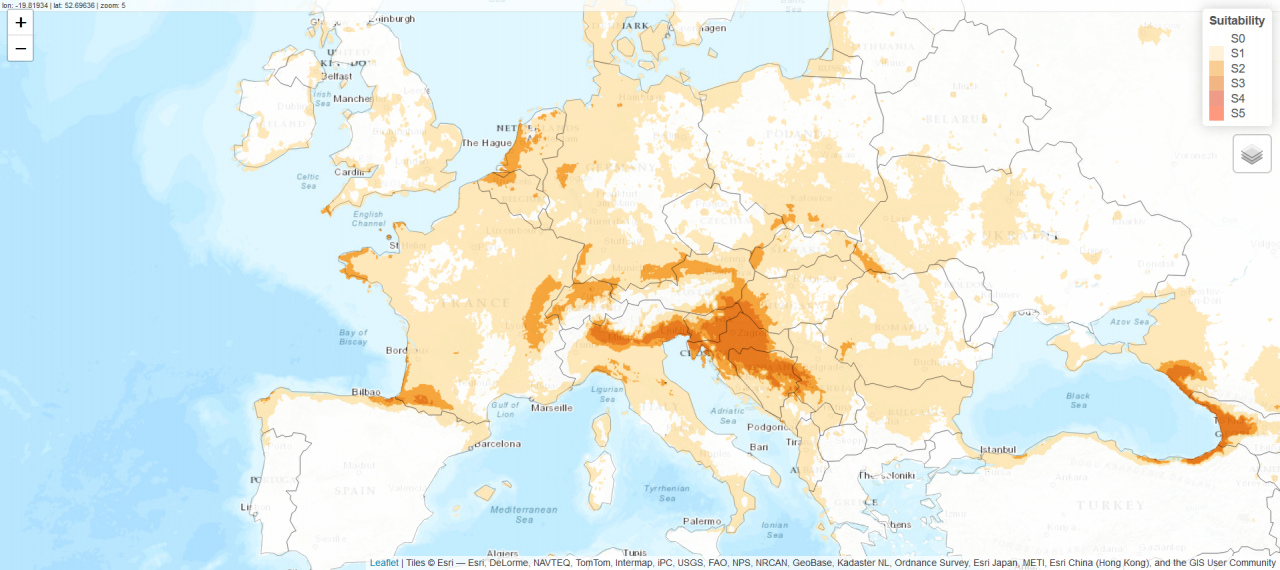
How do I read the suitability maps ?
The short version: Suitability maps use 6 discrete classes of suitability, from S0 to S5. Each class is represented by a colour, with darker colours corresponding to higher levels of suitability.
The longer version: These classes are based on a measure of agreement between predicted presence probabilities and observed proportions of occupied sites (where the species is present). This 'fit' is called model calibration. We trained our model and repeated this process 100 times, for a total of 100 models. We used presence data set aside from model training and observed the proportion of occupied sites in relation to the predicted probability of presence. This allows the predictions to be grouped into classes of increasing suitability, so that the predictions reflect an expected chance of the beetle occurring. S0 indicates an environment that is least favourable to the beetle, where all 100 models predict that the beetle is less likely to be present than would be expected by chance. S5 indicates an environment that is most favourable to the beetle, where models predict that Japanese beetle presence is more than 10 times more likely than expected by chance. In between, classes S1, S2, S3, S4 reflect increasing suitability. For these classes, less than half of the models (S1), more than half of the models (S2) and all of the models (S3) predict that Japanese beetle presence is more likely than expected by chance. Finally, for class S4, the models predict that Japanese beetle presence is more than 5 times more likely than expected by chance.
Read more in the methods section of our open access paper.


